NOVEMBER 2023
2023-2024 ACSA Budget and Enrollment Survey Results
Budget and Enrollment Survey Results
This year’s Budget and Enrollment Survey reflects changes in budgets, applications, enrollment, academic staffing, and curricula at 70 member schools. The survey was made available to ACSA Full, Candidate, Canadian, 2-year, and 4-year members. The survey is conducted annually and this report includes data collection dating as far back as the 2010-11 academic year. The purpose of this report is (1) to provide a cross-section of information regarding the current status of funding and admissions at architecture schools, (2) identify any ongoing trends survey results may suggest, and (3) answer some frequently asked questions by program administrators. An analysis of the survey findings are provided below.
PART 1: ARCHITECTURE PROGRAM BUDGETS
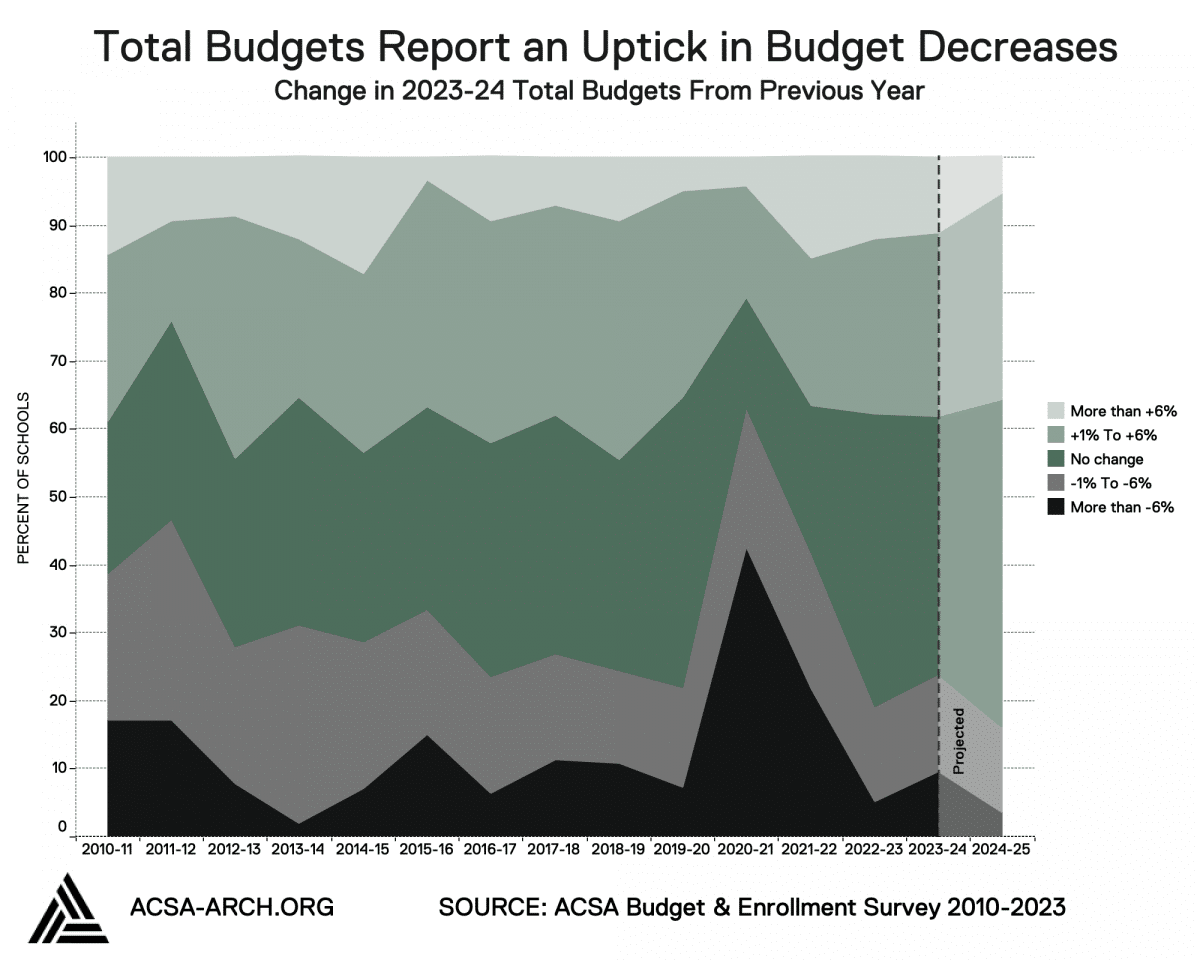
As compared to the previous year, total budgets across architecture programs showed a slight uptick (5%) in the percent of schools reporting a decrease. While the percent of programs that reported no change decreased (from 43% last year to 38% this year), the percent of schools reporting both minimal and major increases from last year remained the same (38%). Looking forward, program administrators predict stable projections for the 2024-25 school year with the majority of schools reporting no change.
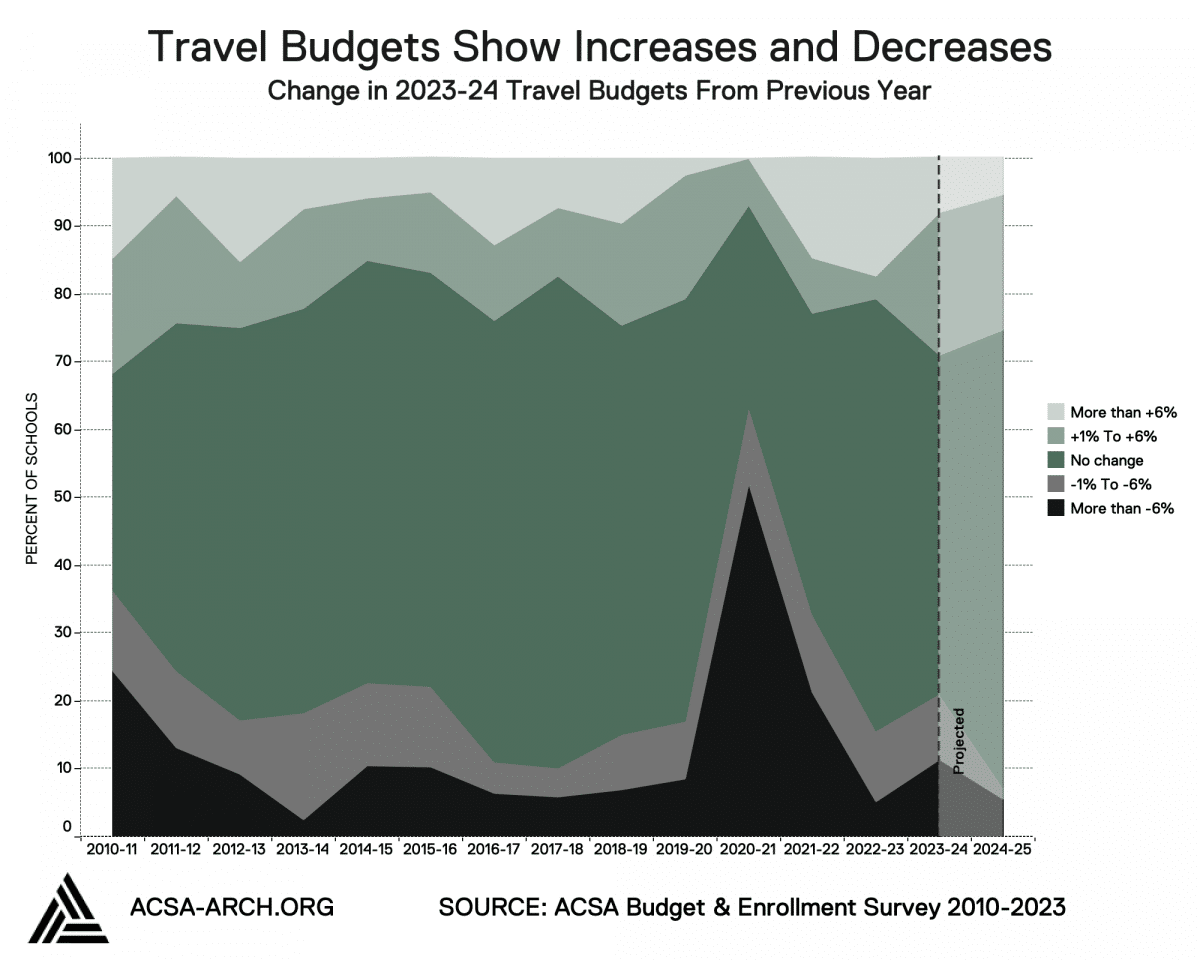
Half of the participating respondents noted no changes in their travel budgets. However, there appears to be more movement in the percent of schools that reported either an increase or a decrease. Projections for the 2024-25 school year are expected to mimic pre-COVID-19 pandemic numbers with an increase in schools reporting no change.
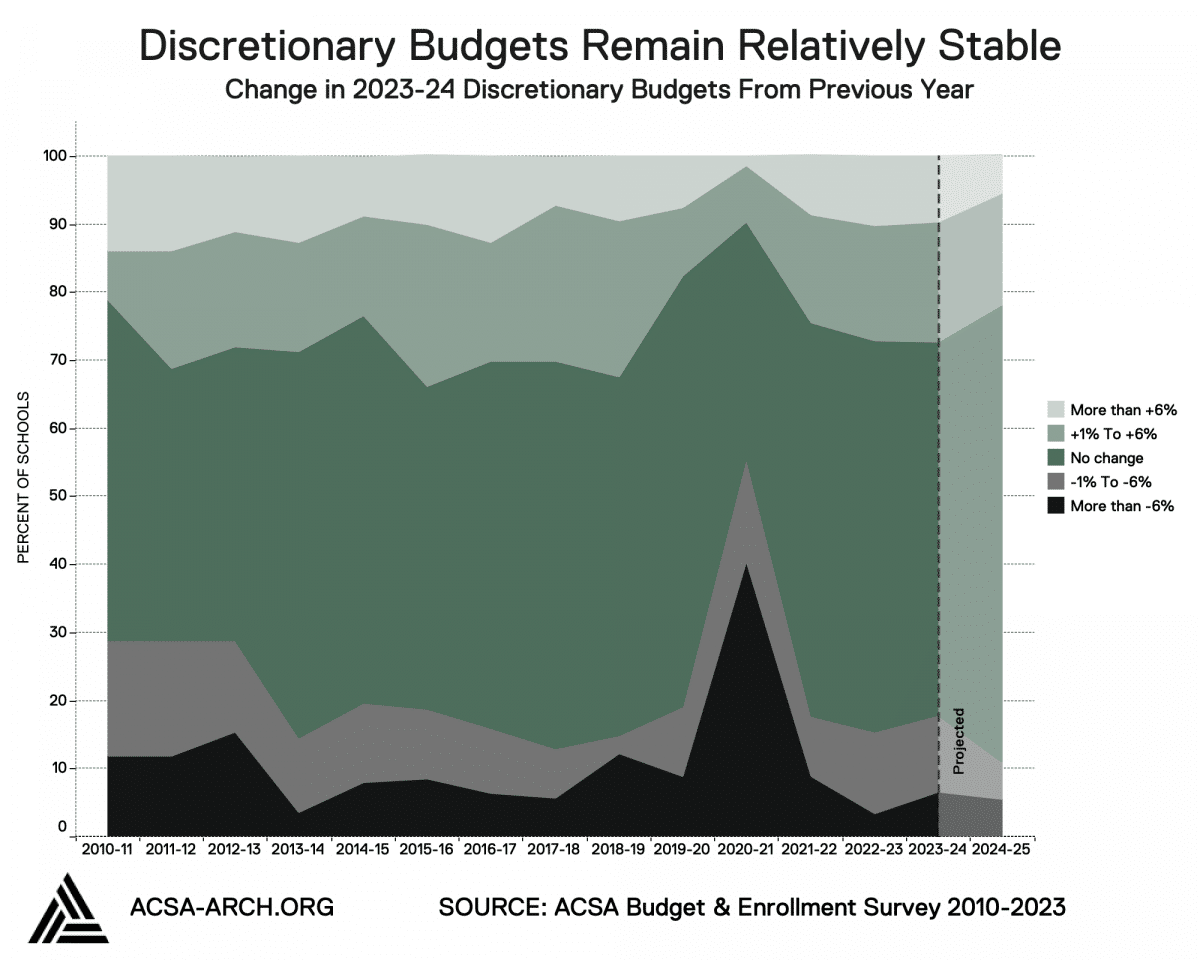
Similar to travel budgets, the majority of schools report no change in discretionary budgets from the 2022-23 to the 2023-24 academic year. Overall the little movement suggest stability in architecture program budgets as indicated by responses over the last 3 years.
PART 2: ARCHITECTURE PROGRAM ENROLLMENT
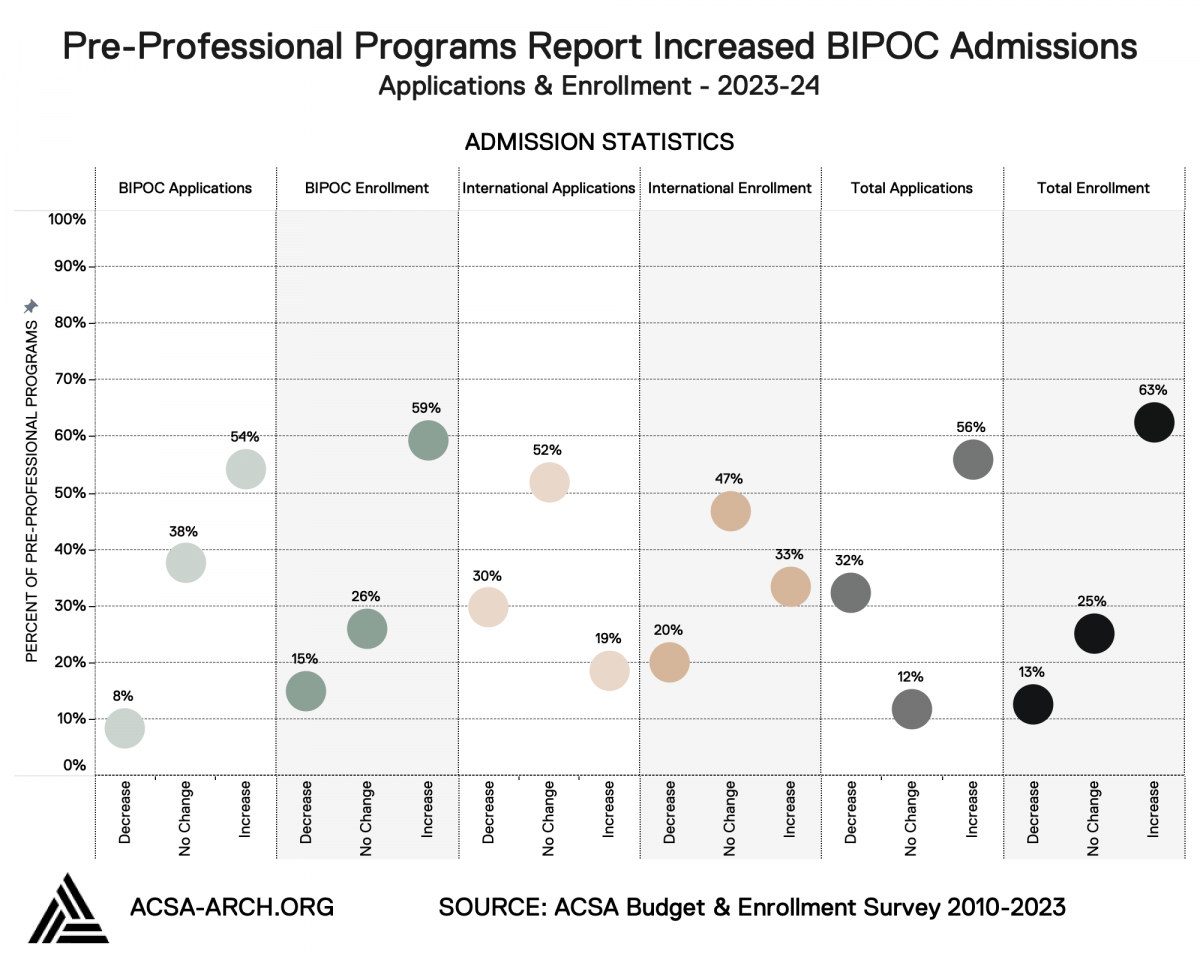
The majority of pre-professional programs reported an increase in applications and enrollment. As has been the case for undergraduate admissions, the reported increase in applicants (54%) and admits (59%) who identify as Black, Indigenous, or other racialized people group seems to trend in the same direction of total applications (56%) and enrollment (63%).
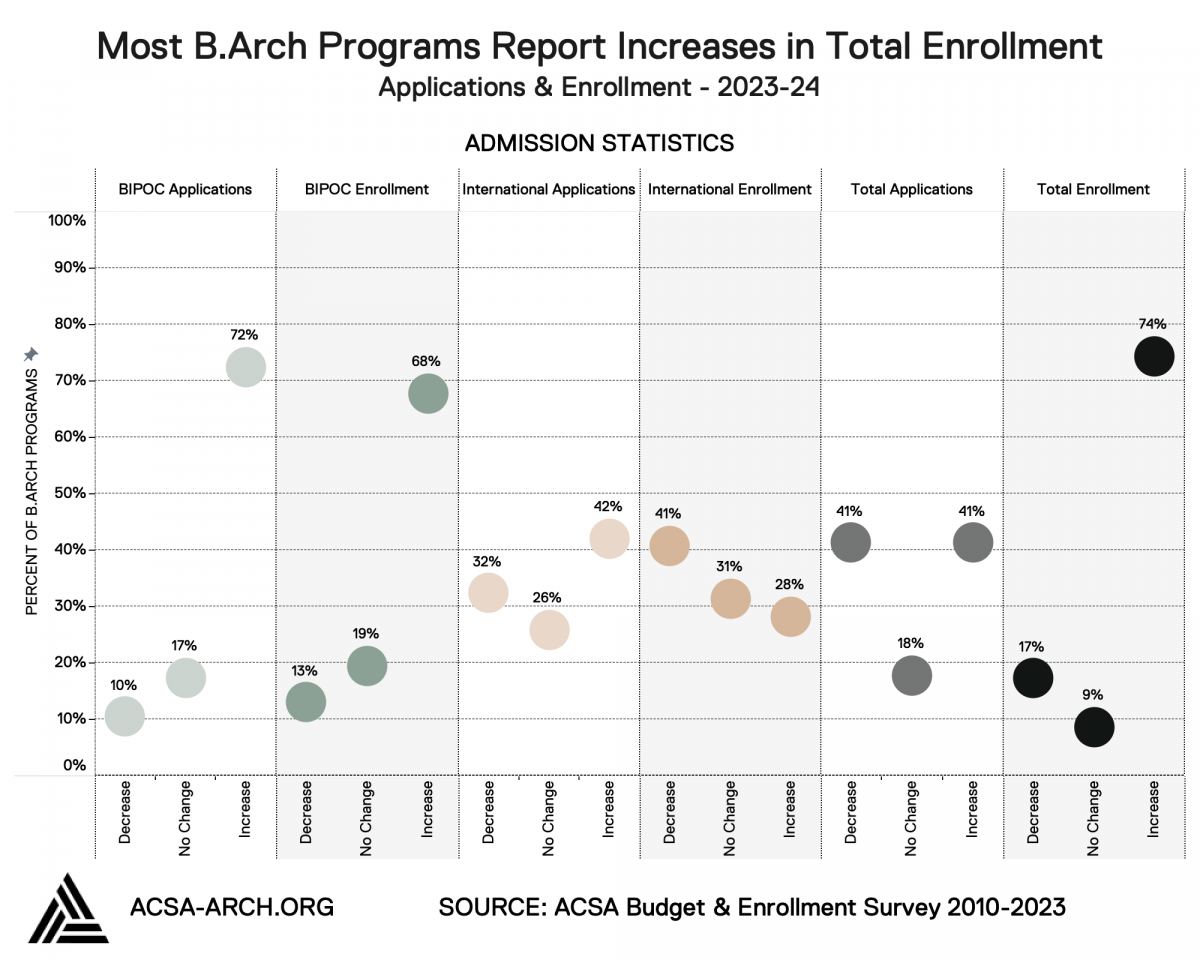
The majority of B.Arch programs reported an increase in applications and enrollment. When compared to all the architecture program types, B.Arch programs reported the most significant increase of applicants (72%) and admits (68%) who identify as Black, Indigenous, or other racialized people group. The B.Arch programs were also most likely to report an increase in total enrollment (74%) but did not see the same returns in total applications.
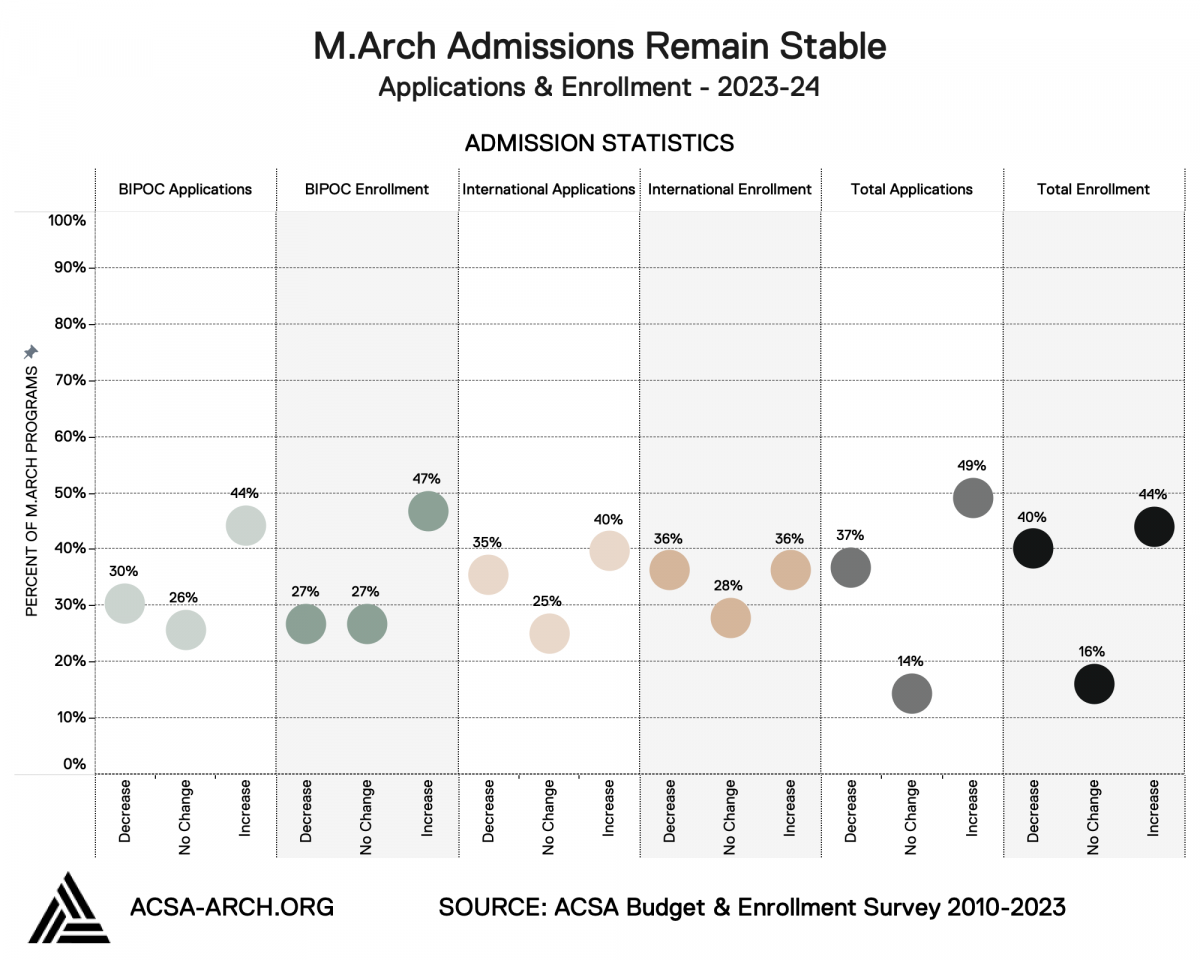
With moderate increases in M.Arch applications and enrollment, this is a stable year for M.Arch programs. Admission metrics for BIPOC, International, and total populations have a very narrow margin and there does not seem to be congruence around whether programs are seeing increases or decreases of either metric. The strongest metric reported this year is the 49% of schools reporting an increase in applications.
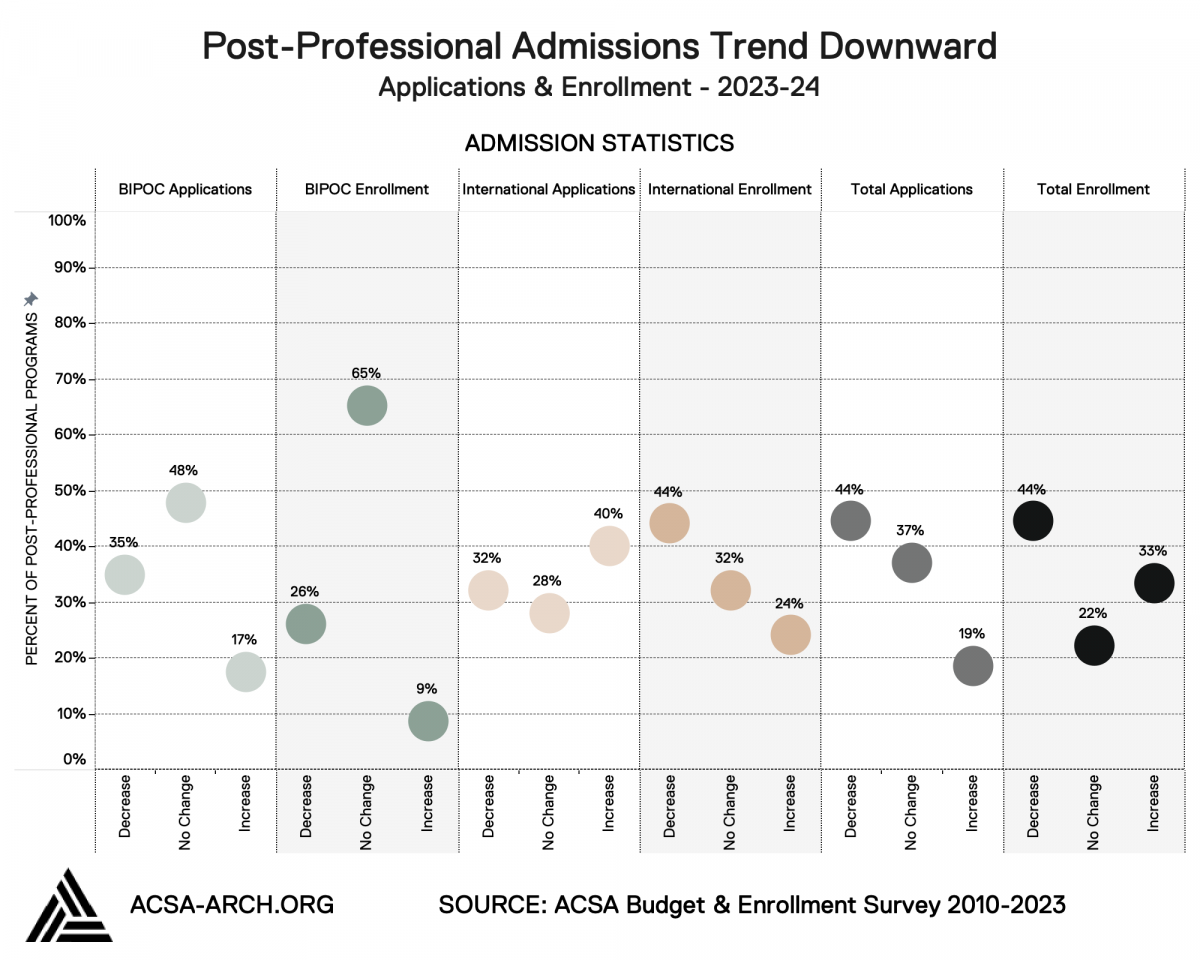
Overall, post-professional programs reported International enrollment, total applications, and total enrollment with 44% of programs reporting decreases. BIPOC student applications and enrollments reported no change as the most frequently selected option for programs and less than 20% of respondents in either category reporting an increase. This degree type is often the hardest to gather data for because the metrics are not collected by the National Architectural Accrediting Board (NAAB). Nevertheless, the numbers reporting increase, decrease and no change indicate waning numbers in admissions across the board.
PART 3: FACULTY FINDINGS
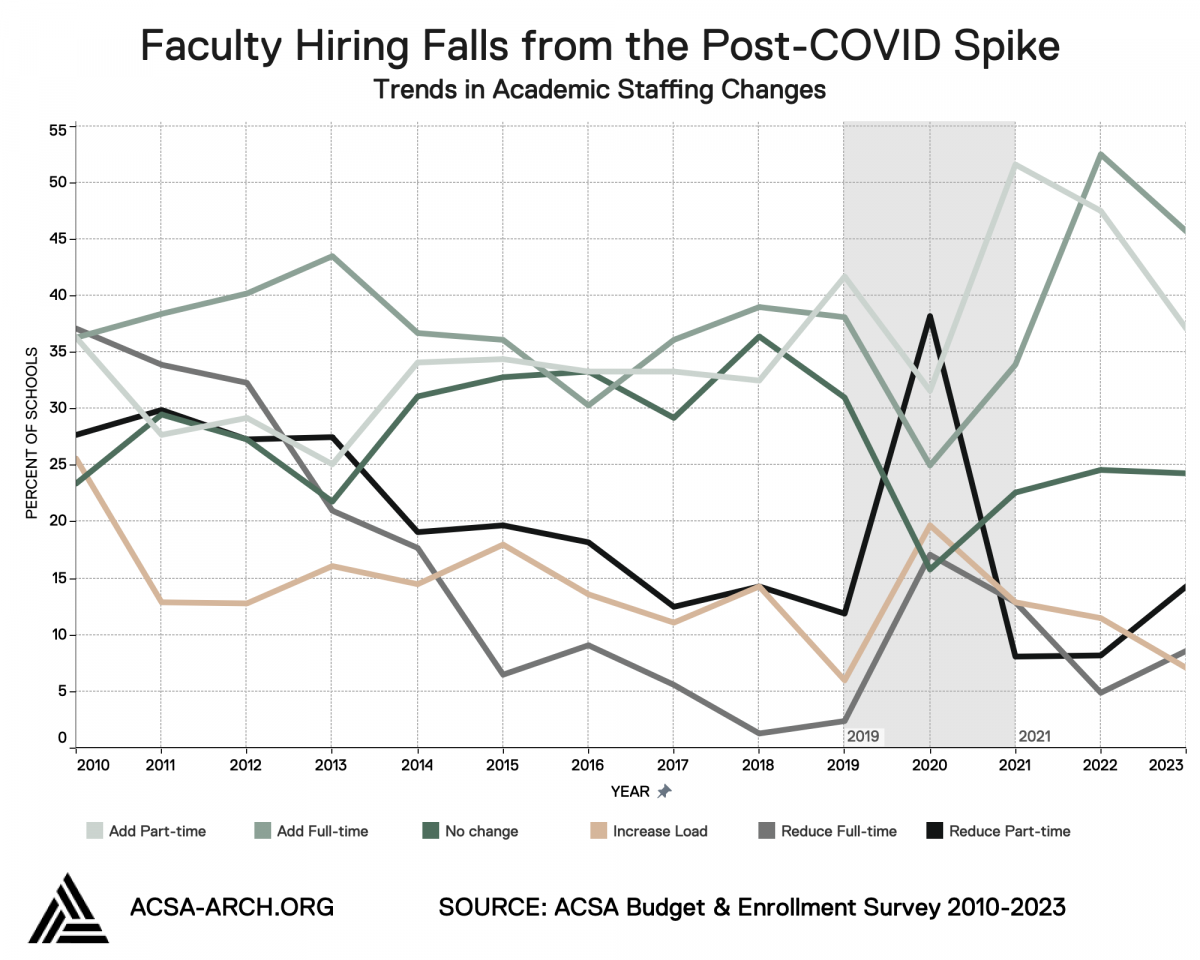
Unlike years past, this year’s budget and enrollment survey shows a 10% decline in academic staffing for adding both full-time and part-time faculty positions, respectively. In response to lifting restrictions related to the COVID-19 pandemic, last year more than half of the participating schools reported adding full-time faculty (53%) and almost half (48%) reported adding part-time faculty. When coupled with the reported increase in the percent of schools showing a reduction of full-time (9%) and part-time faculty (14%), this dip in hiring hints towards a stable future.
PART 4: OTHER PROGRAM FINDINGS
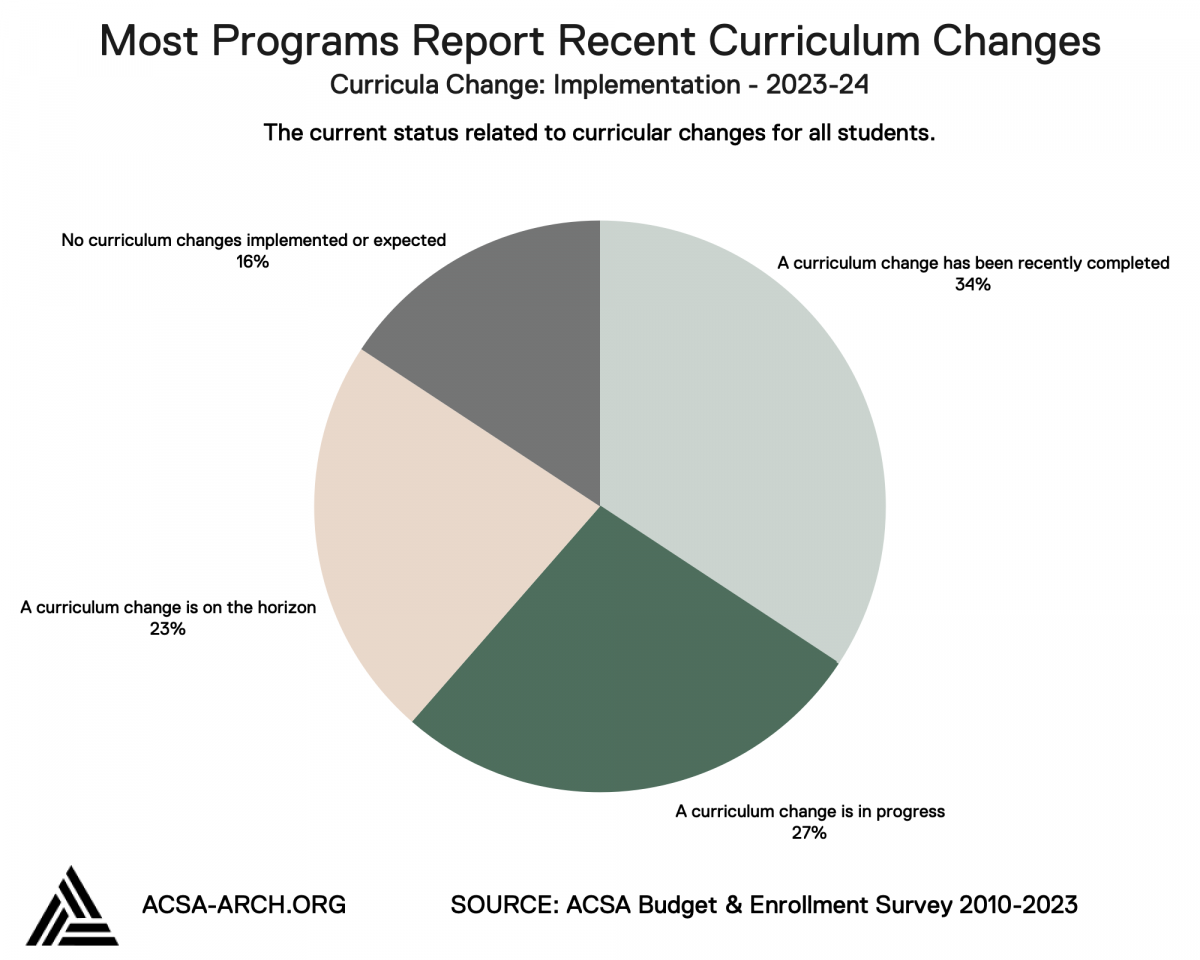
This year, in addition to budgets and enrollment, we explored a few metrics related to curricula changes. On the whole, architecture programs reported either starting, finishing, or completing a curriculum change in the past 3 years. When asked about the current status of curriculum changes, 34% of schools reported “Implementation of a curriculum change has been completed in the past three years.” Moreover, approximately one in four reported either “A curriculum change is in the planning process and will be implemented within the near future” (23%) or “A curriculum change is in progress” (27%).
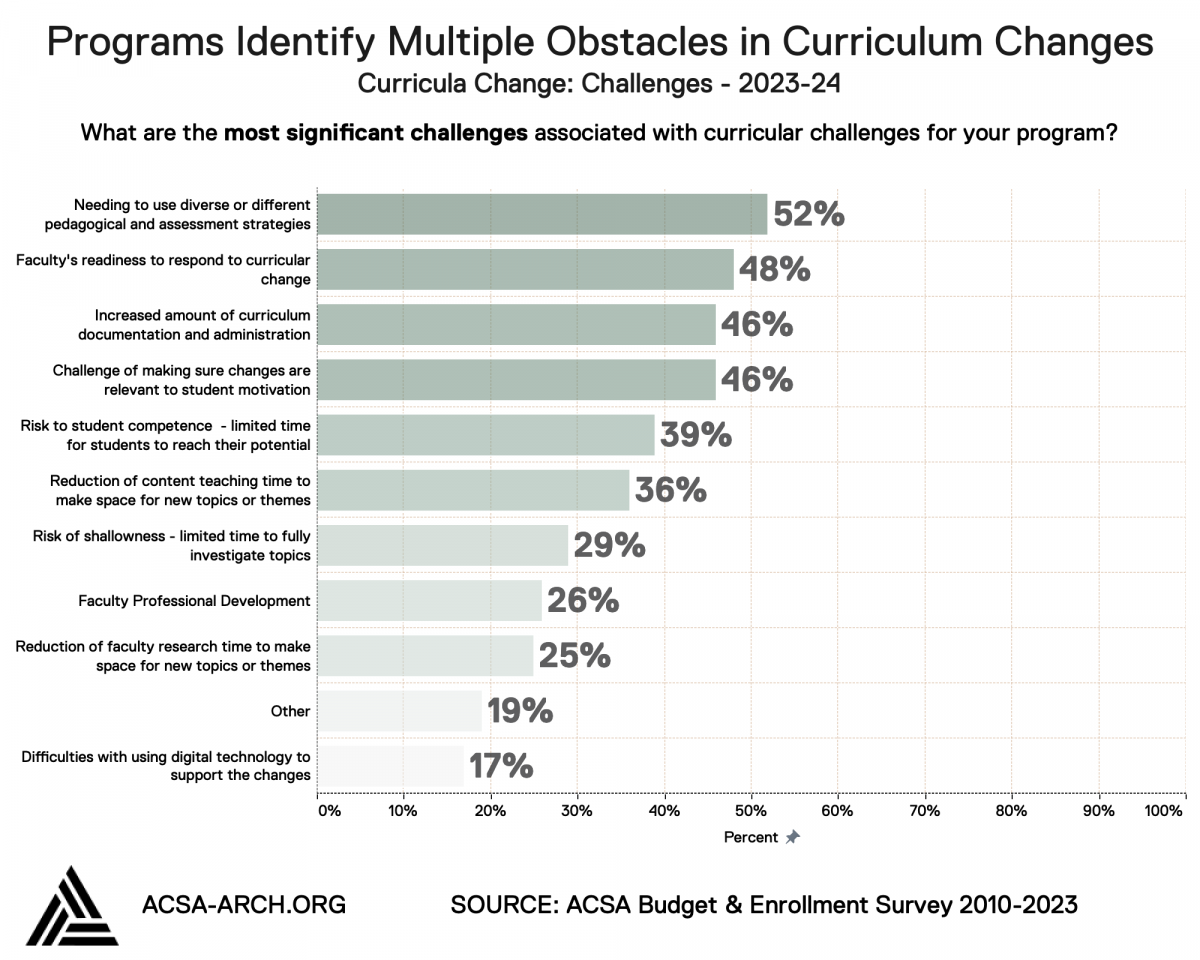
Mimicking a larger survey of higher education on the topic of curricular changes, we asked respondents to identify the most significant challenges to changes in curriculum. Interestingly, there was little congruence among the 5 most popular responses. It does not appear that curriculum change is hard because faculty are resistant, students aren’t ready, or issues of access and resources, but rather because it causes a chain reaction of events that require everything, faculty, students, and spaces, to adapt. That being said, slightly more than half (52%) reported a major challenge being the need for “diverse and different pedagogical and assessment strategies.”
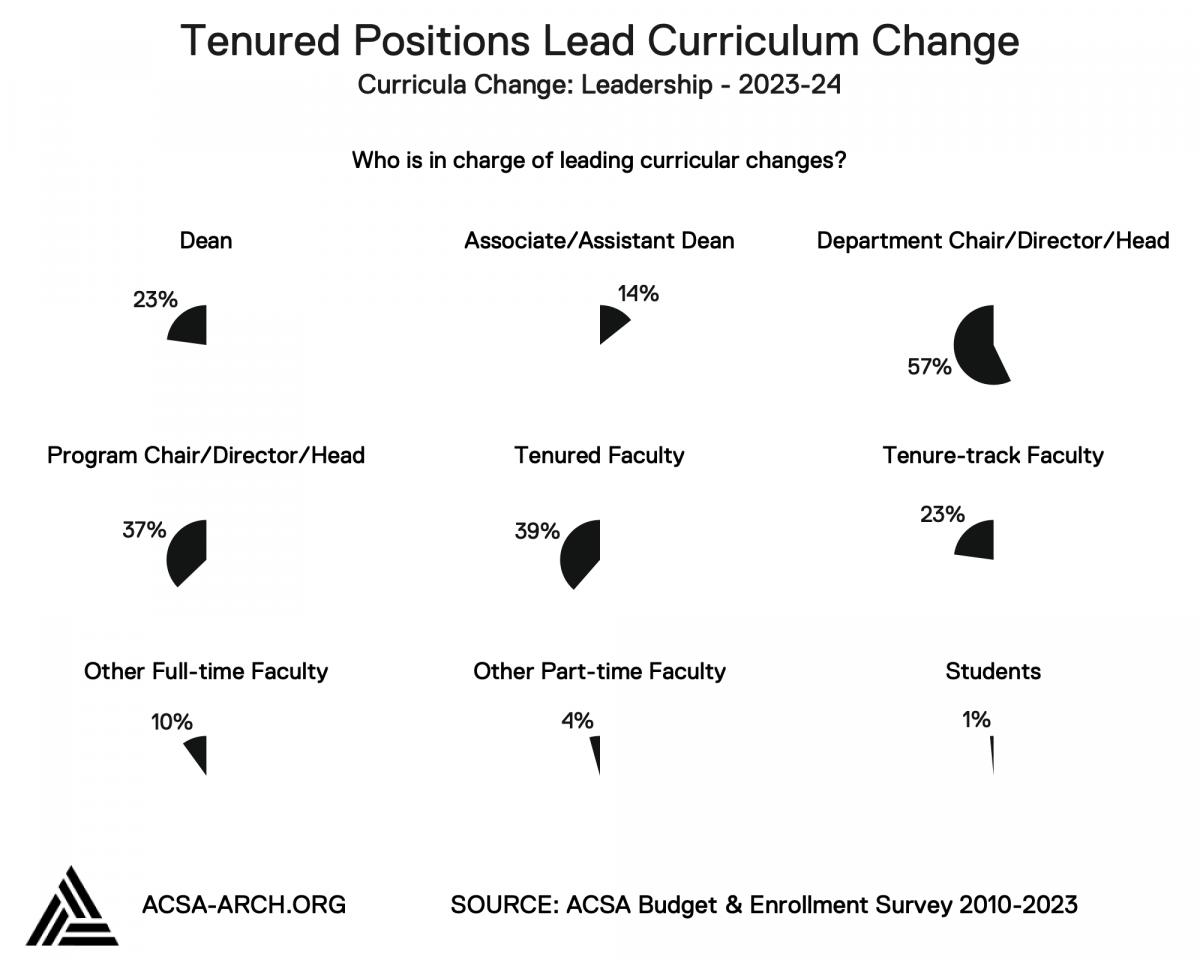
Finally, we asked program administrators about whose duty it is to lead efforts to change and revise curricula at the school. While 23% noted this was the responsibility of the Dean, the majority of respondents (57%) reported curriculum changes as being led by Department level administrators, followed by other tenured faculty (39%) and program chairs (37%). In future iterations, it would be apt to draw a greater distinction between curriculum leadership and curriculum involvement which might lead to more program administrators citing students (1%).
ACSA would like to thank all of the schools that shared their data in regards to budget, enrollment, applications and academic staffing. School participation is integral in our quest to provide a full and accurate picture of these dynamics across architecture schools.
Questions
Kendall Nicholson
Senior Director of Research, Equity, and Education
202-785-2324
knicholson@acsa-arch.org
