Budget and Enrollment Survey Results
This year’s Budget and Enrollment Survey reflects budget, applications, enrollment, studio dynamics, and academic staffing changes at 63 member schools. The survey was made available to all ACSA member institutions, including 2-year, 4-year, and international programs. The survey is conducted annually and this report includes data collection dating as far back as the 2010-11 academic year. The purpose of this report is (1) to provide a cross-section of information regarding the current status of funding and admissions at architecture schools, (2) identify any ongoing trends survey results may suggest, and (3) answer some frequently asked questions by program administrators. An analysis of the survey findings is provided below.
PART 1: ARCHITECTURE PROGRAM BUDGETS
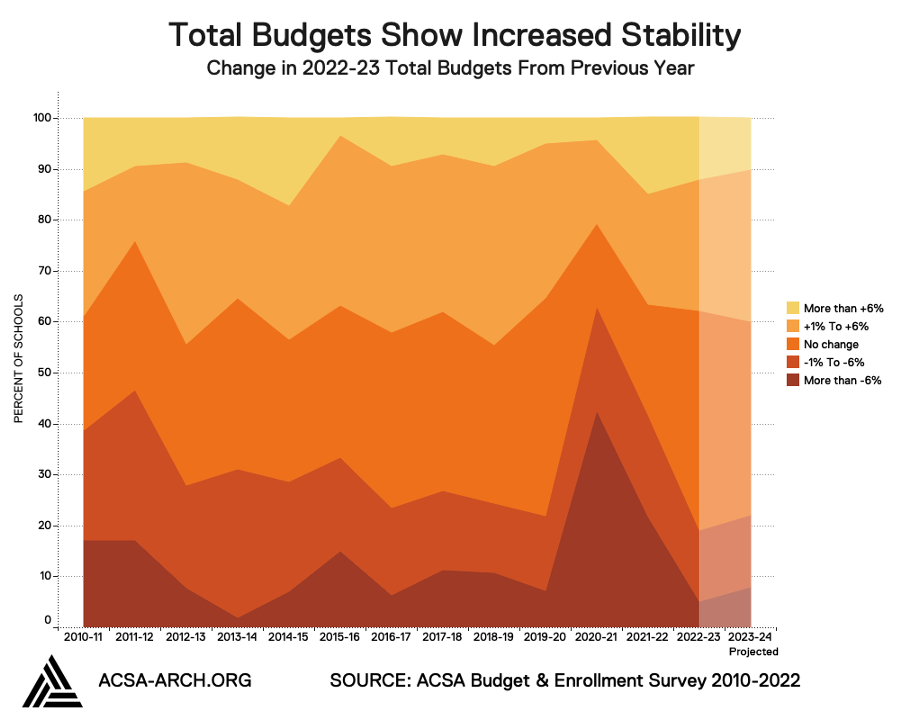
As compared to the previous year, total budgets across architecture programs showed a slight uptick in the percent of schools reporting an increase (38%). However, the percent of programs that reported no change (43%) in 2022-23 has returned to its pre-COVID-19 pandemic numbers. Moreover, the percent of programs that reported a large decrease (More than -6%) decreased from 22% last year to 5% this year.
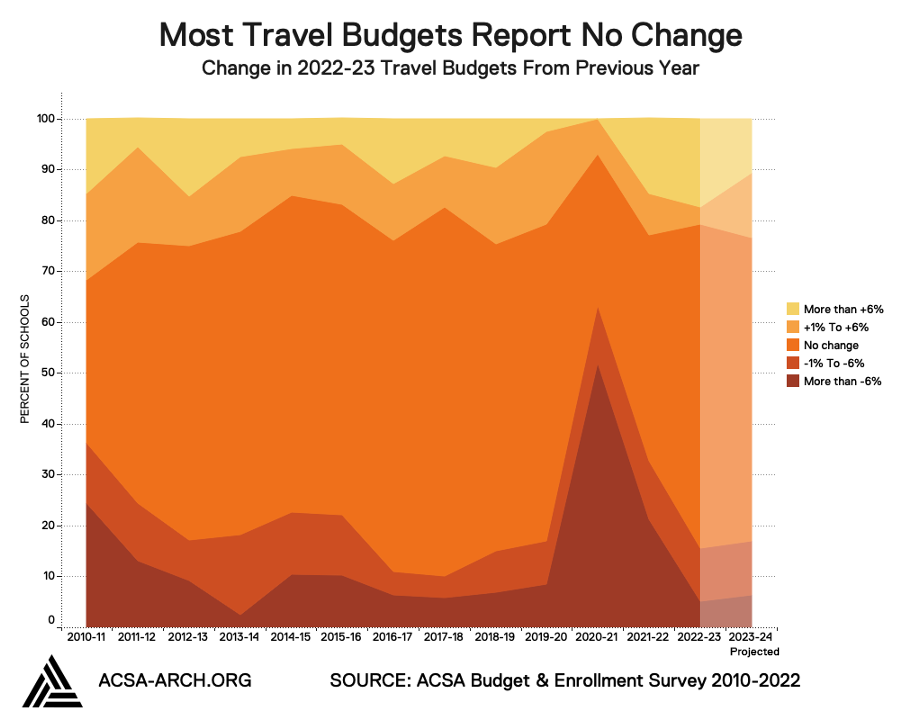
The most notable statistic for travel budgets this year is the increased stabilization. Almost two-thirds (64%) of the schools participating noted no change in travel budgets. Over the past two years, we’ve collectively seen the COVID-19 travel restrictions disappear, corresponding with anecdotal evidence that faculty and students have resumed travel for courses and conferences. Approximately 17% of programs report a large increase in travel budgets (More than 6%).
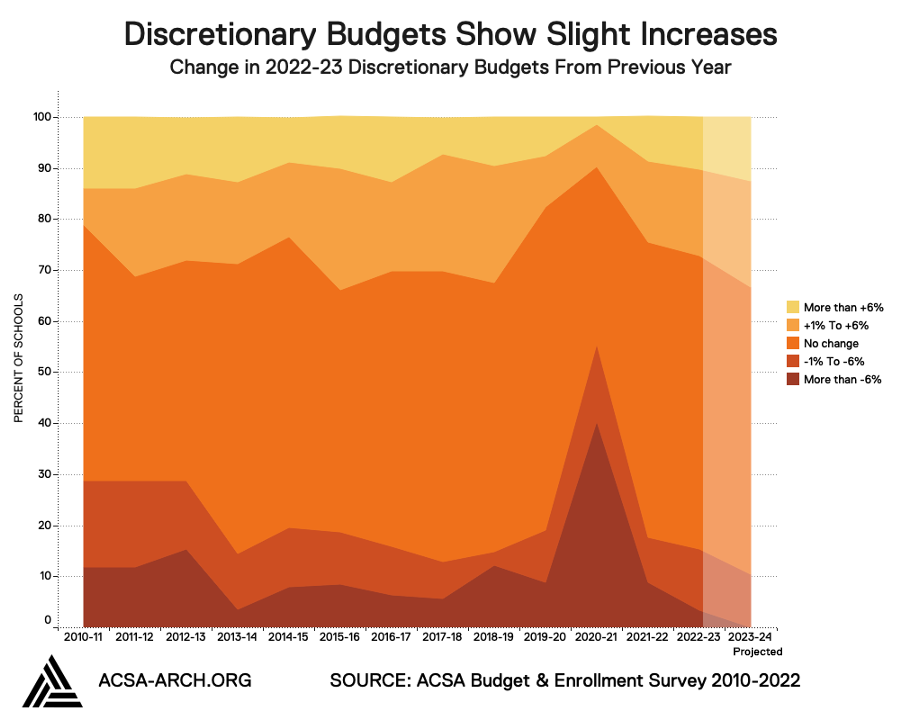
Compared to the 2020-21 numbers at the height of the COVID-19 pandemic, discretionary budgets have completely rebounded. Schools reporting a major decrease in funds for discretionary use is at an all-time low (3%) and is projected to drop completely. Conversely, more than one-fourth of the participating schools reported an increase in this budget type.
PART 2: ARCHITECTURE PROGRAM ENROLLMENT
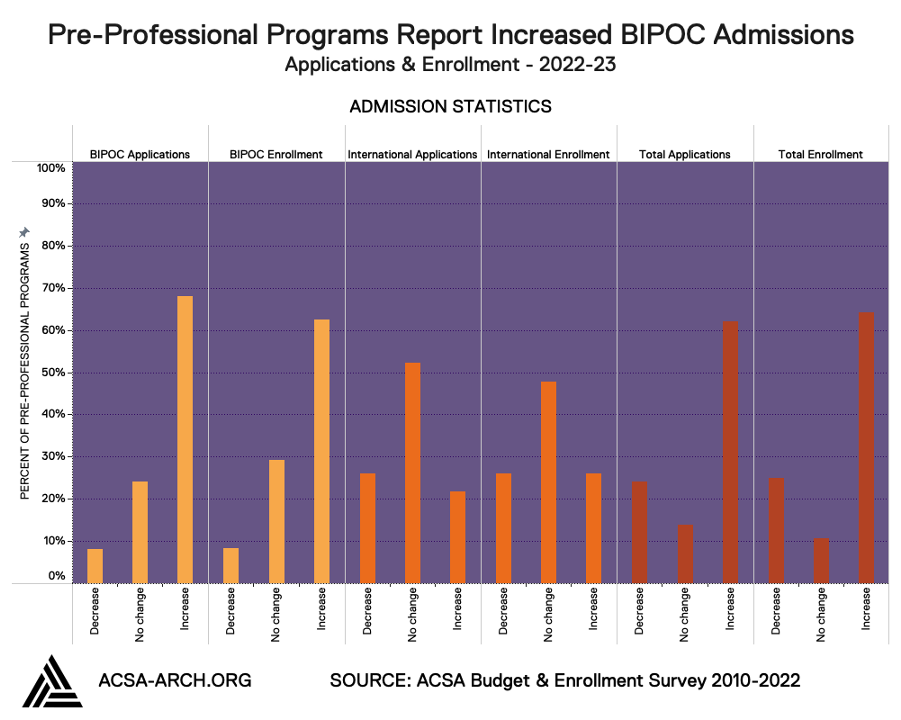
The majority of Pre-Professional programs reported an increase in applications and enrollment but of all the architecture program types, Pre-Professional programs reported the most significant increase of applicants (68%) and admits (63%) who identify as Black, Indigenous, or other racialized people group. Only 8% of programs reported a decrease in their BIPOC applicants and admits.
The B.Arch programs were most likely to report an increase in total applications and enrollment with 70% reporting increases in applications alone. However, admission statistics for BIPOC and International students show a larger proportion of programs reporting no change.

With moderate increases in M.Arch applications and enrollment, this is not a strong year for M.Arch programs. International admission metrics average a 15-16% margin of increasing over decreasing and the percent of schools reporting no change remains below 30%. However, despite stronger percentage of programs reporting no change for BIPOC applications and enrollment, 42% and 31% respectively, the total admission statistics indicate less neutrality.

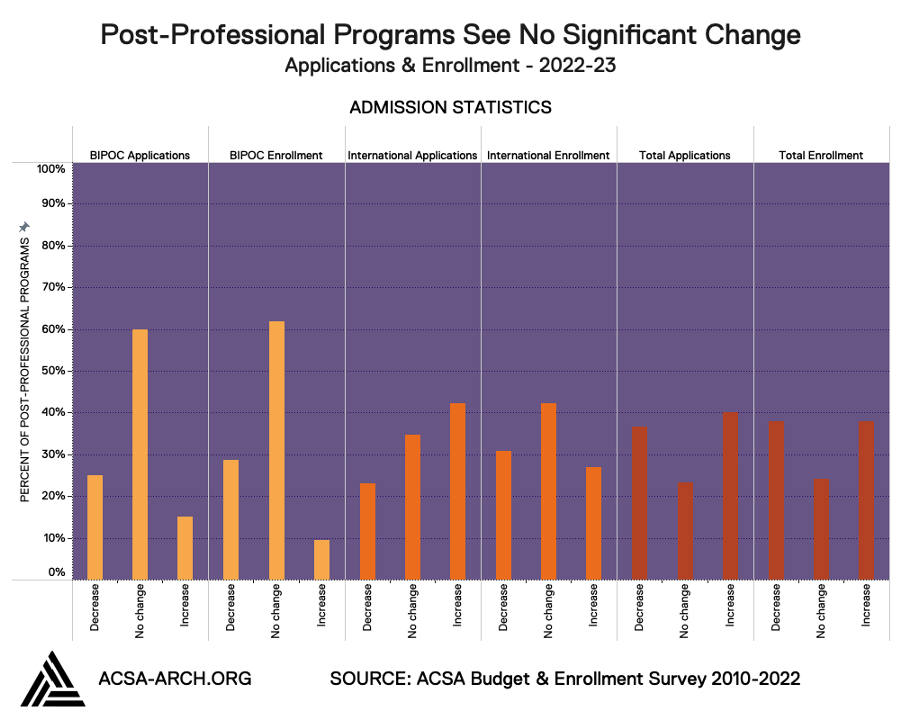
Overall, Post-Professional programs saw little change in 2022-23 admissions. BIPOC student applications and both BIPOC and International student enrollments show no change as the most frequently selected option for programs. This degree type is often the hardest to gather data for because the metrics are not collected by the National Architectural Accrediting Board (NAAB). Nevertheless, the numbers reporting increase, decrease and no change indicate stability in admissions across the board.
PART 3: OTHER PROGRAM FINDINGS
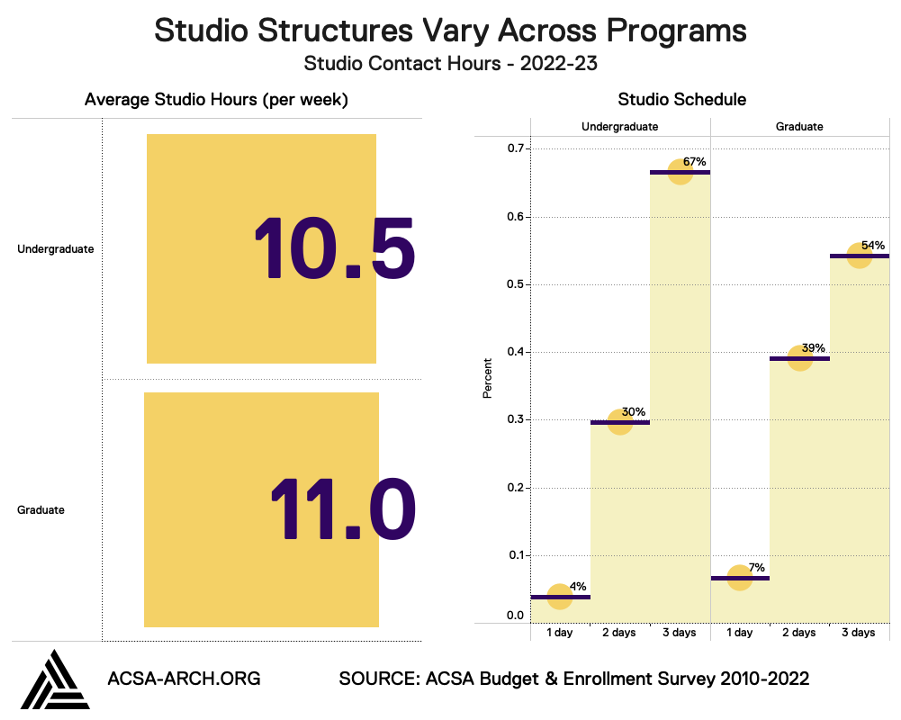
This year, in addition to budgets and enrollment, we explored a few metrics related to studio courses and meeting frequency. On average, undergraduate studios meet for 10.5 hours each week and graduate studios meet for 11 hours each week. While the majority of studio courses are meeting three days a weeks, two-thirds (67%) of undergraduate programs reported this schedule whereas just over half (54%) of graduate programs reported this schedule. A larger share of graduate programs meet two days a week which may indicate the level of support needed by the differing student bodies, the need to consider faculty schedules, and/or the need to share studio space.
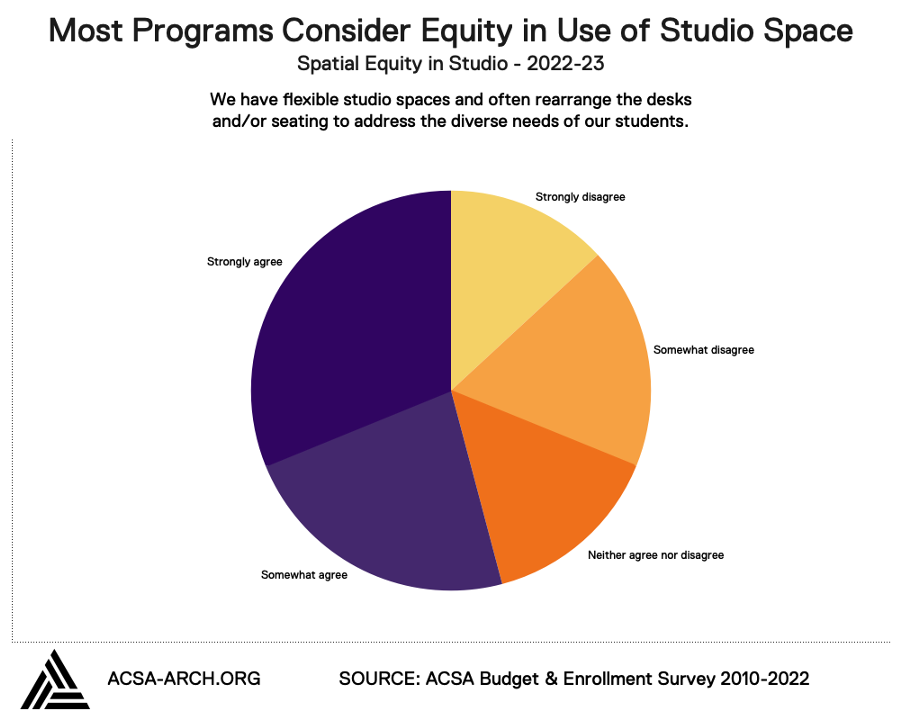
On the heels of research on equity in studio spaces, we asked programs to self-assess the level of agreement with the following statement: We have flexible studio spaces and often rearrange the desks and/or seating to address the diverse needs of our students.
In response to this statement, 31% of schools reported disagreement but the majority (54%) of participating programs reported some level of agreement (31% strongly agree, 23% somewhat agree). More research would need to be conducted to better understand the amount of agency students have to activate the flexibility in studio space.
This topic is discussed in greater detail in our recent webinar entitled Towards a more JUST Design Studio: Analyzing Power Dynamics in Our Studio Spaces
PART 4: FACULTY FINDINGS
One of the major headlines for this year’s budget and enrollment survey is the outlook on academic staffing. While the COVID-19 pandemic is still a very real and present threat, many of the restrictions on budgets and hiring at academic institutions have been lifted. For the first time in the history of the survey’s 13 years, more than half of the participating schools reported adding full-time faculty (53%) and almost half (48%) reported adding part-time faculty. Moreover, the percent of schools reporting a reduction in full-time faculty is also at an all time low (5%).

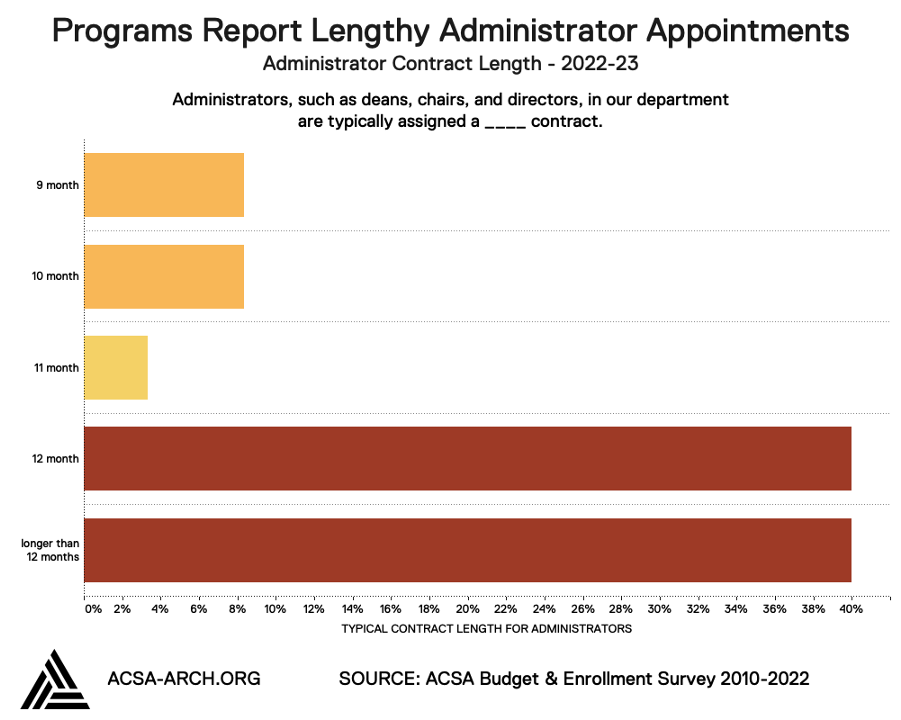
Finally, we asked program administrators about administrative appointments in an effort to confirm or deny a sense that administrative position have a standard length of 12 month contracts. Our results show that 80% of programs have administrative appointments for deans, directors, and chairs that are 12 months or longer. This 40/40 split leaves no clear majority but does indicate that a 9, 10, or 11 month appointment is considered an outlier.
ACSA would like to thank all of the schools that shared their data in regards to budget, enrollment, applications and academic staffing. School participation is integral in our quest to provide a full and accurate picture of these dynamics across architecture schools.
Questions
Kendall Nicholson
Director of Research and Information
202-785-2324
knicholson@acsa-arch.org
