February 2015
Gender has been big news in architecture lately. On this page, we’re studying the stories, trajectories, satisfaction, and salaries of women and men in architecture based on data from Archinect’s Architecture Salary Poll.
You can also take a more analytic look at this data through charts and maps at how firm types and job titles and licensure make a difference in architecture careers. Or return to the main page for this section to explore individual career stories.
Men and Women’s Career Stories
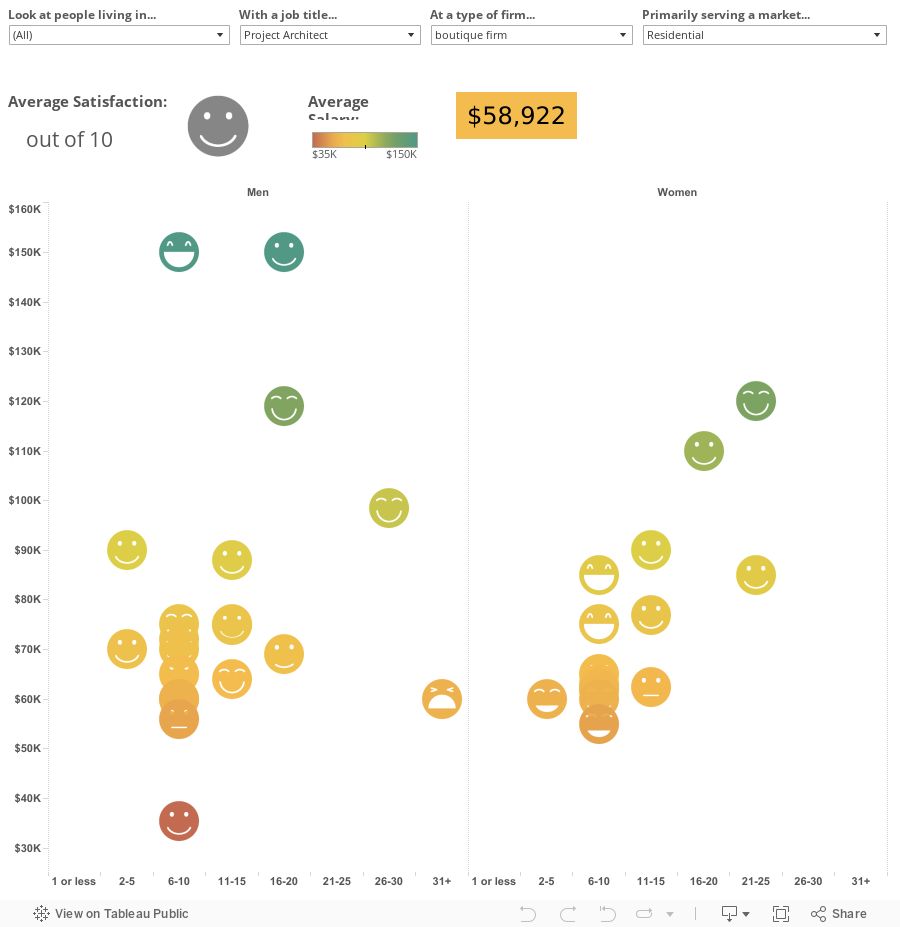
Who is happy in their job? How much do women and men earn with more experience? Do job titles matter? This first interactive lets you ask these questions, and compare responses by gender, while still drawing on individual stories. In most cases, filtering by geography OR job characteristics will give you a good number of stories to compare. If you don’t see enough results, try setting more filters to “All.”
Age, Experience, and Salary
Do women in architecture earn less than men? If they do, is it because they take time out to give birth and raise children? Do they like their jobs? In this section, we’ll dive into the data to untangle these factors.
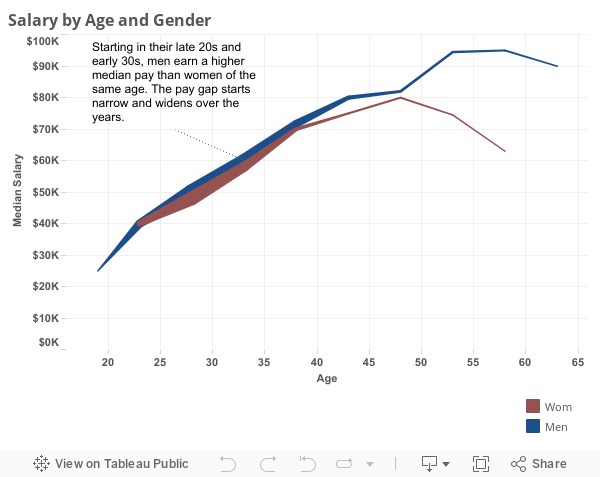
Women earn less than men of the same age, at least after age 40. Under 25 years, our data shows basically equal median salaries for men and women. From 25 to 40 the median salary for men grows to $2,000 more than for women of the same age. After 40, this pay gap widens further to become statistically significant.
This data, all collected in 2013 and 2014, can’t tell us whether this pay gap exists because women’s salaries don’t keep pace with men as they age, or if it’s because today’s younger women started their careers during a time of improved gender equality.
We can, however, look into whether men are earning more than women of the same age because they have more years of experience–so let’s look at years of experience in the next two charts.
If we look at how many years of experience men and women have at different ages, we see a clear pattern.
Until about age 30, men and women of the same age have the same median number of years of experience. This suggests that men and women in their teens and twenties are equally likely to be working and gaining experience, or taking time out to do something else.
But female respondents in their 30s have fewer years of experience than men of the same age. The median (middle) man at age 31-35 has 5 more years of experience than men 5 years younger. But the median woman at age 31-35 only has 2 years more than women 5 years younger. In other words, starting in their thirties, women are taking time out of work to do other things, such as raising children.
That experience gap remains among older women, and doesn’t get significantly wider except among the oldest workers, who hail from a generation ruled by different norms and attitudes.
Since this is not a longitudinal study, we can’t separate out these kinds of generational effects, but the need for women to take at least some time for childbirth and nursing is likely to stay with us.

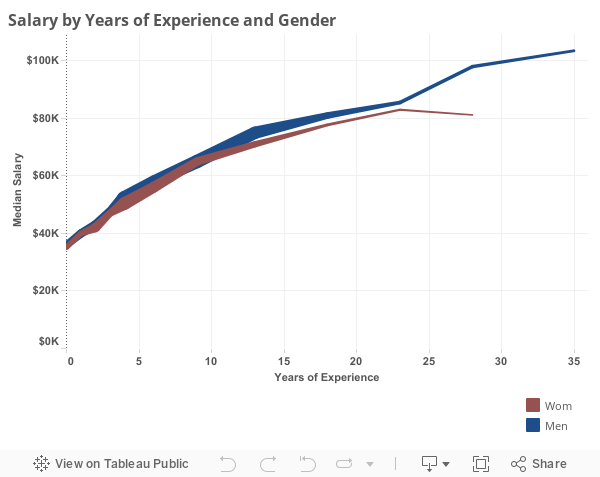
Given that women are likely to have fewer years of experience than men of the same age, a fairer way to compare salaries is by years of experience. In this chart, we can see that even when accounting for different years of experience at each age, a slight gender-based pay gap remains.
This gap is often small. For example, at 4-5 years of experience the median (middle) man earns $2,000 more per year than his female counterpart. But by 11-15 years of experience this gap has become statistically significant, with a difference of $4,000. A pay gap between men and women of equal years of experience was also found by The Missing 32 Percent.
Similarly, the Bureau of Labor Statistics also indicates that women in architecture earn about 83 cents per dollar earned by their male peers. According to the American Association of University Women, this is about on par with other professions such as financial managers, computer programmers, lawyers, and editors, although these figures don’t take into account the higher average years of experience for men.
Small gaps in earnings are compounded over the years and can result in hundreds of thousands, or even over a million dollars, in lost wages over one’s lifetime.
Although this poll doesn’t collect race/ethnicity information, studies about the gender pay gap across the U.S. have found that the gap is worst for Hispanic, African American, and Native women.
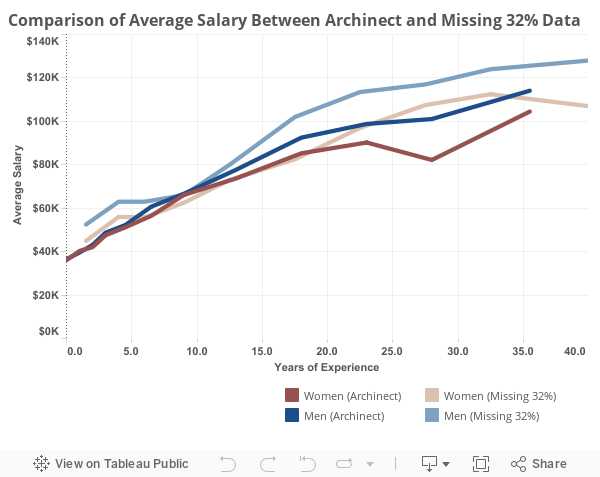
As a spot-check, we compared our Archinect Architecture Salary Poll numbers with those from The Missing 32 Percent’s Equity in Architecture 2014 survey.
Our Archinect salary numbers are generally a bit lower than those found by Missing 32%, except from around 7-12 years of experience where the numbers coincide fairly closely. Given differences between the two surveys’ timeframes, question wording, and sample populations–and the fact that Archinect’s numbers were also reliably lower than those found in the AIA Compensation Report 2013–the difference is not surprising. Importantly, both surveys found a gender-based salary gap that exists early on and widens after around 10 years of experience.
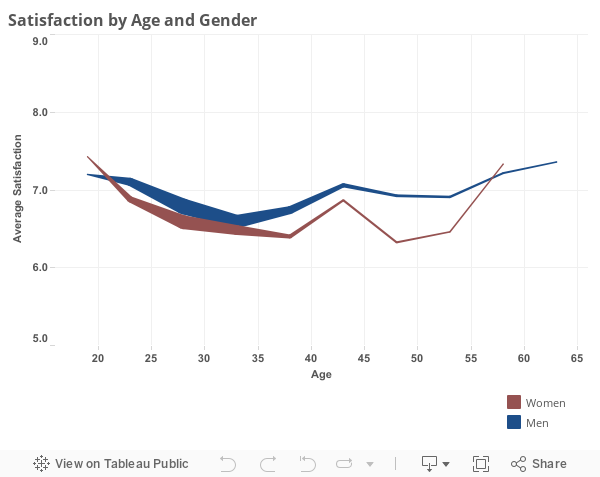
On average, women in architecture enjoy their job less than their male peers, at nearly all ages. What’s more, for both men and women satisfaction declines steadily for at least the first ten years of practice.
The curves for both men’s and women’s job satisfaction start high, are lower in the middle years, and end high. While the dip is moderate–a total drop of 1 satisfaction point for women and 0.6 for men, out of 10–it is statistically significant.
Why is this? We can imagine high satisfaction in the early years being due to youthful optimism, and high satisfaction in the later years due to the pleasures of mastery. Selection also plays a role, since those who don’t enjoy the work may be more likely to leave the profession before reaching their 50s or 60s. These phases of life are not specific to architecture: a study by Princeton University also finds this this U-shaped pattern for overall life satisfaction in the general population in wealthy English-speaking countries.
The other striking pattern in our data is that men in architecture report liking their jobs more than women of the same age, consistently and statistically significantly. The only exceptions are for employees under 20 or older than 56, who represent a very small proportion of respondents overall. This finding is supported by Equity in Architecture Survey 2014, which found that 41% of male respondents but only 28% of female respondents were satisfied at work. What makes this result so notable is that the same study mentioned above found that women in the United States and similar countries are actually happier than men overall.
Finally, our data also shows a brief bump in satisfaction in the 41-45 age range. This may in part be related to general population-wide trends. It’s also possible that in the highly cyclical industry of architecture economic peaks and dips have enduring impacts on the achievement and satisfaction of workers on a generational basis.
Satisfaction is a crucial metric. The more we can learn about why people in their 30s like their jobs in architecture less than those in their 20s, and why women are less satisfied than men, the more we can understand why some are more likely to leave the profession than others.
Factors impacting career satisfaction in architecture and the causes of this gender divide were a focus of The Missing 32 Percent’s Equity in Architecture Survey 2014. This survey found that work-life flexibility, alignment of day-to-day work and long term goals, and perception of a fair promotion process were among contributing factors of satisfaction–so be sure to check out their results.
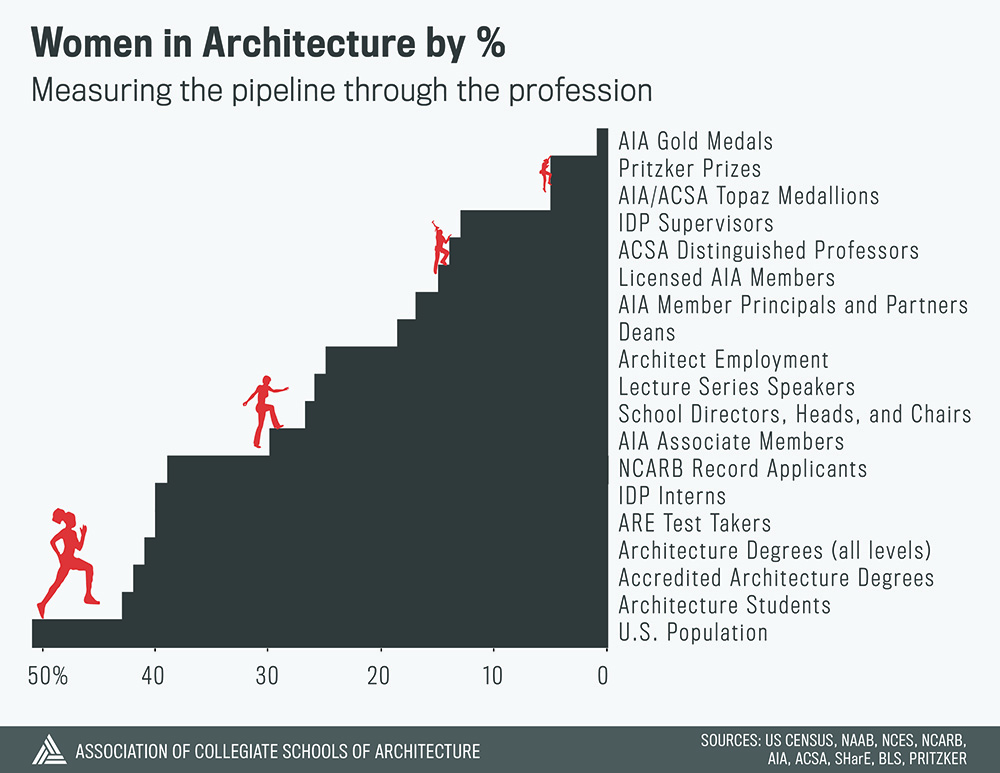
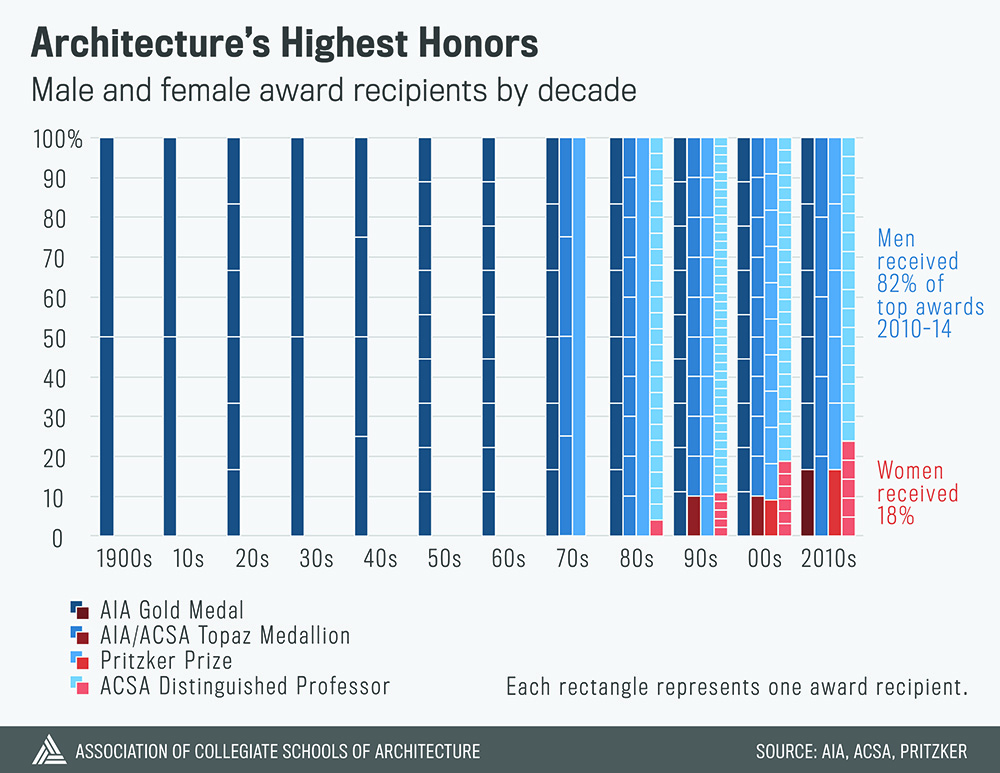
If you’re looking for more on gender from ACSA, we have also tracked the lack of women at higher levels in academia and practice, the gender balance among architecture school deans, directors, heads, and chairs, the gradually increasing share of architecture’s highest honors going to women, and the changes in the pipeline into architecture over time. You can also check out our visualized data on every 2012-13 architecture graduate in architecture and related fields, with a focus on gender and ethnic/racial equity.
Kendall Nicholson
Director of Research + Information
202-785-2324
knicholson@acsa-arch.org
